WARINING: Due to a broken DMV in Power BI Desktop, that I use for this solution, we cannot use this tool anymore, until until Microsoft fixes the issue. Sorry 😐
When I work with customers‘ pbix files, I often deal with files with several hundred measures. At the beginning I like to get an overview which of these measures might not be used at all and could possibly be removed. For this purpose, I have developed a method to locate these measures, which I would like to share in this article. Warning: Please note that this method does not consider the measures used in the Filter Pane! So before you delete a seemingly unused measure, please check if it was used in the Pane filter.
You can download my report file at the end of this post. The download does not require a password. If you are still asked for your OneDrive password, change your browser to Edge.
The definition of unused measures
Unused Measures are Measures that are neither used in any visualization in the .pbix file nor referenced in other Measures, calculated columns or calculated tables! So how can I identify those Measures? Let’s find the answer together…
Gather the necessary information
To find the unused measures, I need the following information:
- A list of all existing measures in the .pbix file,
- A list of the measures used in the visualizations within the .pbix file
- A list of measures referenced by other measures, calculated columns and/or calculated tables.
The logic is the following: When I remove from the all measures list those measures that are used in visualizations, I have those measures that are not used in visualizations. But they can still be referenced in other calculations (and therefore cannot be removed). So, if I hold against the list of all referencing calculations here, I finally get the measures that are not used within the .pbix file.
Retrieve a list of all measures
Since Power BI Desktop runs an instance of SQL Server Analysis Services Tabular in the background, I can use a DMV (Data Management View) to get information about my data model. You can use Power Query to gather this information using the following single line of code:
= OleDb.Query("Provider=MSOLAP.8;Data Source=localhost:61200;Update Isolation Level=2", "SELECT * FROM $SYSTEM.MDSCHEMA_MEASURES")
The result looks like this:
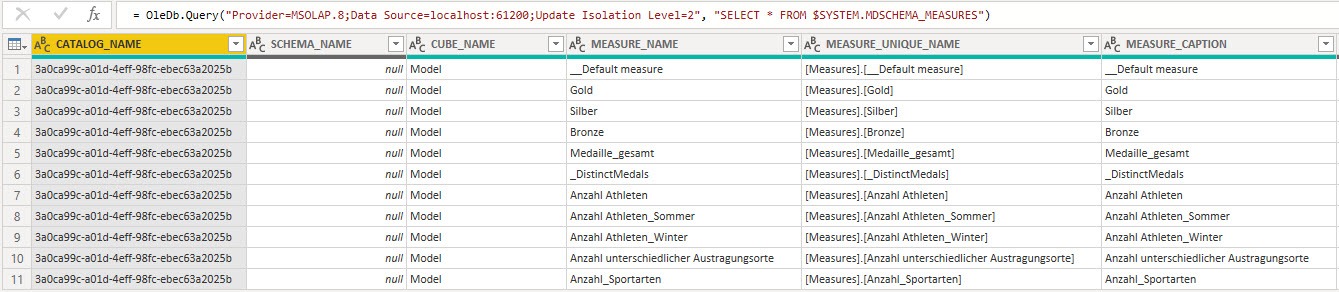
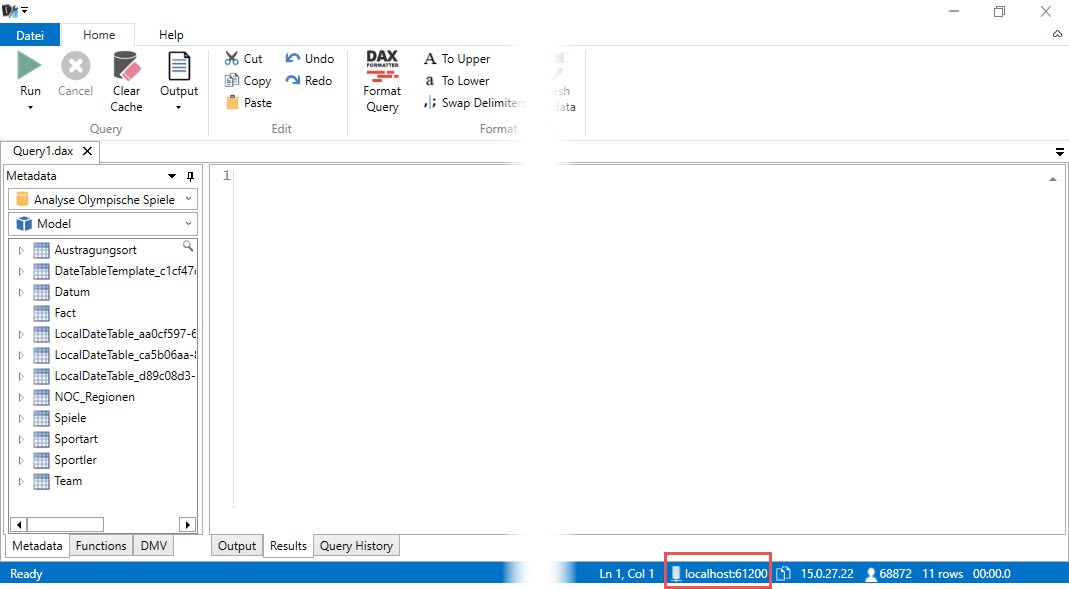
Be aware, that the number 61200 has to be changed in your code, as this is the process ID of the instance of Analysis Services running on your machine. The easiest way to find this number on your machine is to run DAX Studio (download it here) and connect it to your (already opened) pbix file. When you are connected, you find the desired process number in the bottom line, as you can see here:
Now that we have a list of all measures, let’s find those measures, that are used in report pages.
Retrieve a list of Measures, used in report pages in Power BI Desktop
Since May 2019 Power BI Desktop has been equipped with the extremely useful „Performance Analyzer„. This tool helps to find starting points for the optimization of slow reports. But this tool also helps me to identify those measures that are actually used on report pages. Follow these steps:
- Create a blank page
- Go to View → Performance Analzer and make the pane visible
- Click on Start recording
- Then select each page, one after another and wait until the visuals are fully loaded
- Press Stop
- Export the JSON file

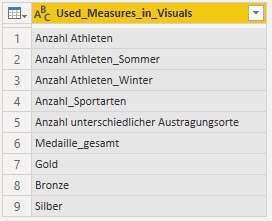
The JSON file contains all DAX queries, generated to update the visuals when selecting the page. If a measure is used in a visual, it is represented in the DAX query and I can extract that information from the JSON file. Of course I use Power Query to do that job for me and the result looks like this:
Intermediate result
With the retrieval of all measures and the JSON file, with all measures used in visuals, I can now make a comparison and determine which measures are not used in visuals. So far, so good. However, just because a measure is not used directly in a visual, it is not automatically unused. It can be referenced in other measures, calculated columns, or calculated tables. Therefore I would like to check whether these now determined measures are really completely unused before I decide how I want to proceed with them…
Retrieve a list of calculation dependencies
The DMV, which I used for the retrieval of all existing measures, is by far not the only one available. Another useful DMV I will use to determine the measures referenced by other measures, calculated columns, or calculated tables is the following: $SYSTEM.discover_calc_dependency (see documentation of this DMV here).
I can again use Power Query to retrieve the results of this DMV like so:
= OleDb.Query("Provider=MSOLAP.8;Data Source=localhost:61200;Update Isolation Level=2", "SELECT * FROM $SYSTEM.discover_calc_dependency")
Again, the process id 61200 has to be changed to find the Analysis Services instance on your machine.
The result looks like this:
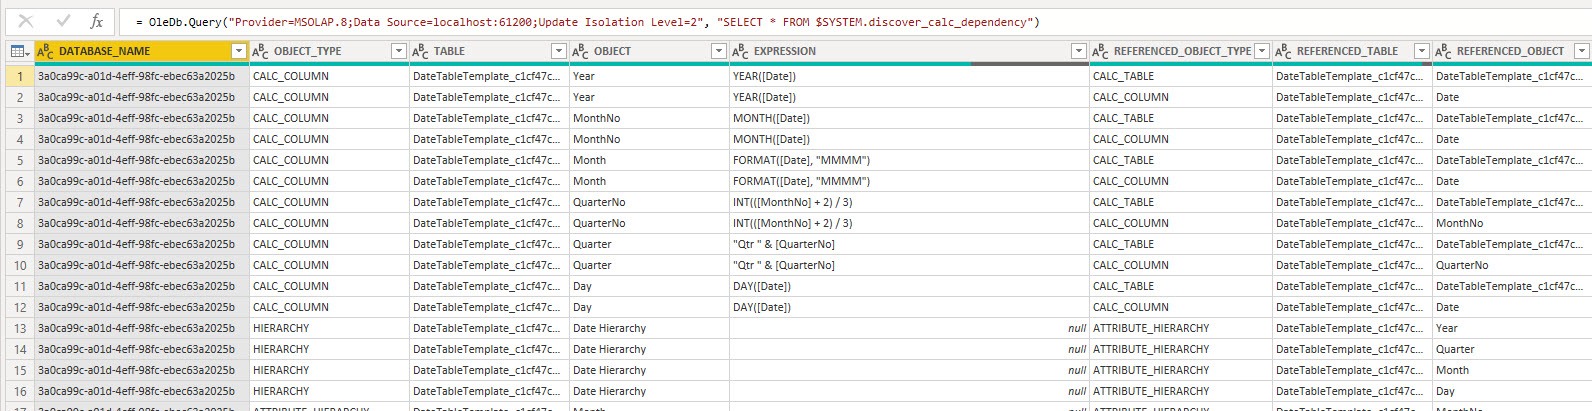
This DMV returns a clear picture of the interdependencies of calculations. For me this DMV answers the question in which measures, calculated columns and/or calculated tables my measure is referenced. If a measure is not used in any visualization and does not appear in the calculation dependencies, it is unused.
The final table
With all this information, I can now create the following table, which tells me whether a measure is used in report pages and whether it is referenced in any way:
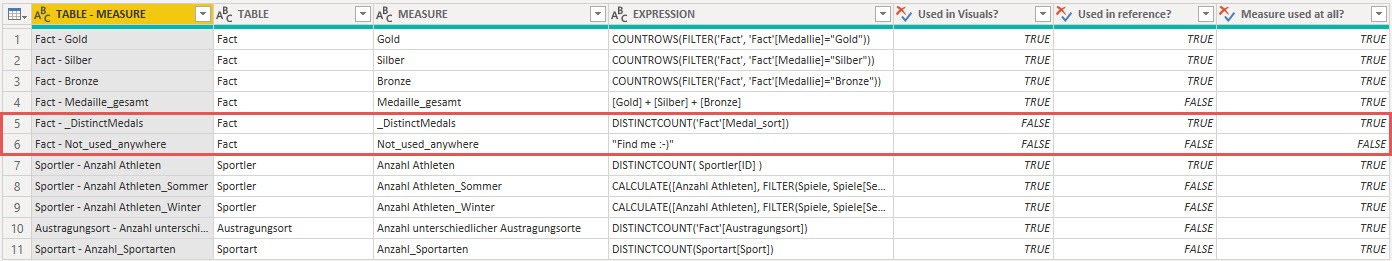
The screenshot shows in line 5 that the measure _Distinct_Medals is not used in visuals, but is at least referenced by other measures, calculated columns and/or tables. The measure „Not_used_anywhere“ is neither referenced nor used in visuals.
Download and usage of my Measure Analysis pbix file
I loaded all the described data from DMVs and the JSON export file into a pbix file and added a (very small, but helpful) report. Admittedly, I didn’t take any trouble with the optical design. I’ll leave that to you 😉
You can download the report file here.
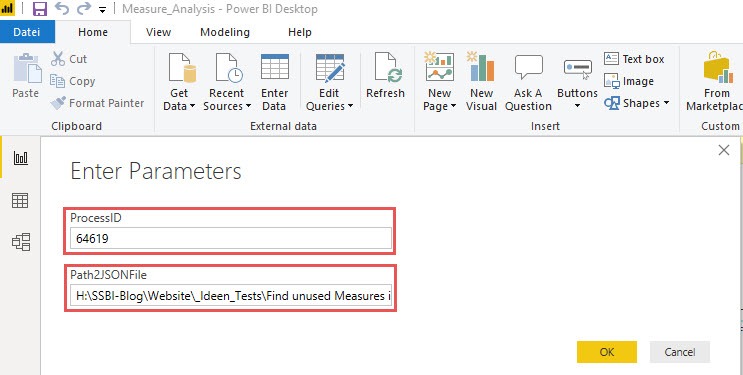
Open the file and edit two parameters:
- the process ID of the Analysis Services instance
- the path and name of the exported JSON file (Make sure that your string does not contain quotation marks at the beginning and at the end)

After you have clicked OK, you will see the following message in the upper part of the report page:
![]()
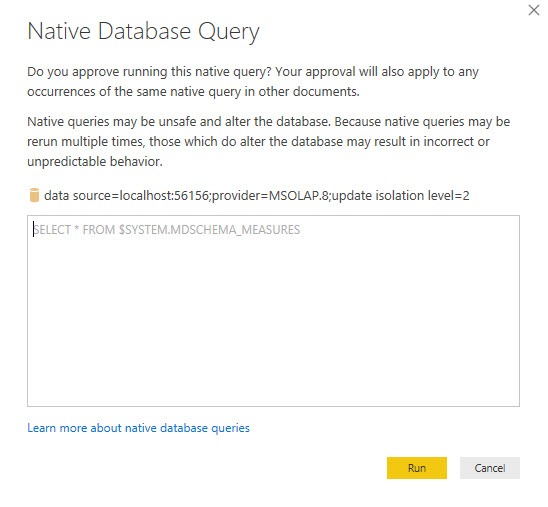
Click on „Apply changes“ and click on „Run“ in the following dialog, to allow the run of the DMV MDSCHEMA_MEASURES:
Then you will be asked to enter your credentials. Use „Windows“ and „Use my current credentials“:

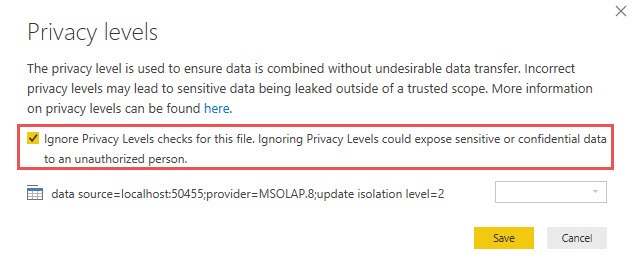
After you have entered your credentials, Power Query prompts you to determine the privacy levels for the data source. Since in this particular case the communication between this PBIX file and the Analysis Services instance is behind the file to be analyzed, you can safely click on „Ignore Privacy Levels…“:
Click on „Apply changes“ and click on „Run“ in the following dialog, to allow the run of the DMV :

After the model refreshed, you can use the following report:
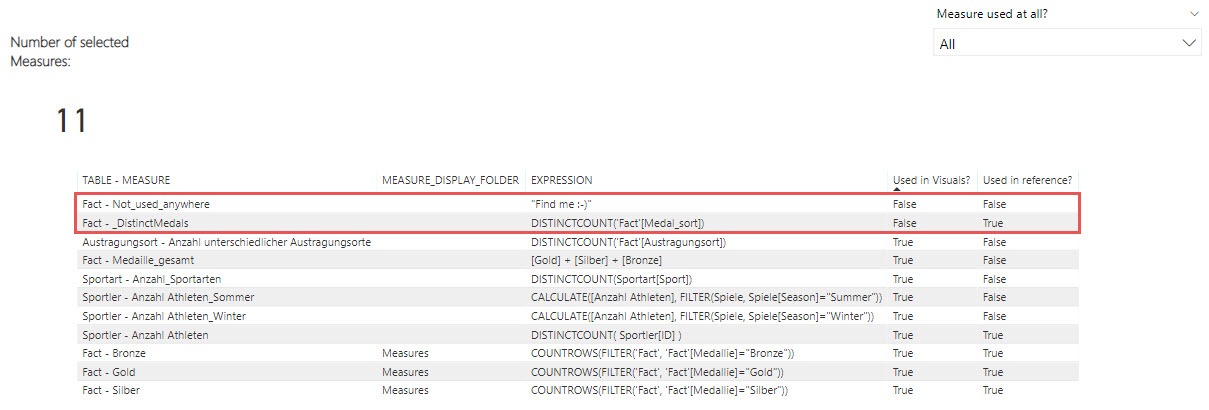
Here is a short description of the report:
- Column1: Table name and Measure name.
- Column2: If the measure was stored in a folder, you can read it here.
- Column3: DAX-Expression of the measure
- Column4: Is the measure used in a visual, somewhere in this pbix file?
- Column5: Is this measure referenced by any measure, calculated column/ table in this pbix file?
I hope that this manual will help you to bring even more order into your data models 🙂
Greetings from Germany,
Lars

Lars ist Berater, Entwickler und Trainer für Microsoft Power BI. Er ist zertifizierter Power BI-Experte und Microsoft Trainer. Für sein Engagement in der internationalen Community wurde Lars seit 2017 jährlich durch Microsoft der MVP-Award verliehen. Lies hier mehr…
Raymond meint
Wow, very nice.
Its still working also in the latest Power bi version
How can i make overview for each measure which visual is used on which report is that possible?
Alex Diaz meint
Brilliant!
Simple and effective. Thanks for sharing!
Henrik Vestergaard meint
Is the solution working in spite of the foreword from Mr. Schriber: „WARINING: Due to a broken DMV in Power BI Desktop, that I use for this solution, we cannot use this tool anymore, until until Microsoft fixes the issue. Sorry“ ?
Regards, Henrik?
DZ meint
Perfect tutorial. Thank you Lars
Zeke meint
This is absolutely amazing! Thankyou!
Kadir meint
In powerbi i have one page with over 40 visuals which appears and disappears with like 50 bookmarks. How will i get all the json files?
Shhram Es meint
You can refactor the queries in the report as follows to get them to work. I created a parameter called „Database“ that you can find by running a DMV query in DAX Studio — see comment below.
let
// to get database, run this in DAX Studio: SELECT [CATALOG_NAME] FROM $SYSTEM.DBSCHEMA_CATALOGS
Source = AnalysisServices.Database(
„localhost:“ & Number.ToText(ProcessID),
Database,
[Query=“SELECT * FROM $SYSTEM.discover_calc_dependency“]),
#“Geänderter Typ1″ = Table.TransformColumnTypes(Source,{{„DATABASE_NAME“, type text}, {„OBJECT_TYPE“, type text}, {„TABLE“, type text}, {„OBJECT“, type text}, {„EXPRESSION“, type text}, {„REFERENCED_OBJECT_TYPE“, type text}, {„REFERENCED_TABLE“, type text}, {„REFERENCED_OBJECT“, type text}, {„REFERENCED_EXPRESSION“, type text}, {„QUERY“, type text}}),
#“Gefilterte Zeilen“ = Table.SelectRows(#“Geänderter Typ1″, each ([REFERENCED_OBJECT_TYPE] = „MEASURE“)),
#“Sortierte Zeilen“ = Table.Sort(#“Gefilterte Zeilen“,{{„REFERENCED_OBJECT“, Order.Ascending}}),
#“Entfernte Duplikate“ = Table.Distinct(#“Sortierte Zeilen“, {„REFERENCED_OBJECT“})
in
#“Entfernte Duplikate“
Goat Kamal meint
https://pypi.org/project/PyDaxExtract/ if using python can help.
Rene meint
Thanks, works on powerbi version april 2021
Dom meint
Hi Lars,
do you know if there is a way to identify in which visual exactly a measure is used? By doing this you would be able to narrow down where you have used a specific measure. In case of a huge report that would be very helpful.
Thanks in advanced.
Cheers,
Dom
Mijalis Méndiz Pazos meint
Hello Dom,
You can do that with Dax Studio, one by one yes, but still, it may solve your problems. You just have to open Dax Studio, search for the measure, right-click on it and select the option „Show objects that reference the measure“. It will print a table with all the objects and measures that use the one you are analyzing. It also works for columns.
Best regards
Mijalis
Stefan meint
So far the best thing I came across B-) your the best man, I one hour I have removed 24 unused measures in our model
Nick meint
Works great. Thank you!
Jon Marquet meint
I’m having an issue when trying to run in Power Query:
= OleDb.Query(„Provider=MSOLAP.8;Data Source=localhost:62201;Update Isolation Level=2“, „SELECT * FROM $SYSTEM.discover_calc_dependency“)
I get the following error message:
DataSource.Error: OLE DB: Se ha detectado un nodo de dependencia no admitido.
Details:
DataSourceKind=OleDb
DataSourcePath=data source=localhost:62201;provider=MSOLAP.8;update isolation level=2
Message=Se ha detectado un nodo de dependencia no admitido.
ErrorCode=-2147467259
I have no idea how to solve it. It’s something about the dependency node, but i have no clue how it works.
Any help would be much apreciated.
Thank you.
Charaf meint
Same here.
Lars Schreiber meint
Hi Jon,
I haven’t used the tool myself for a while. The hard truth is, that the DMV ‚discover_calc_dependency‘ which is queried in the M statement above, is broken and cannot be queried anymore from Power BI Desktop. This is no issue of my tool, but an issue of Power BI Desktop. You will get the same problem in DAX Studio, when you try to query this DMV. Due to this issue, my tool cannot be used until the broken DMV will work again 🙁
Thanks,
Lars
Jon Marquet meint
Hi Lars.
Thank you very much for your answer and for your effort.
Let´s see if Microsoft solves the issue as soon as possible and the tool works again. It’s a really usefull tool.
Thanks again,
Jon
Nathany meint
Hi there, it’s me again, I’ve just posted in the comments about measures names in the json files, and I downloaded your pbix and could finally understand the steps that you used to get those names. Thank you!!!!!!!
Nathany meint
Hi there, first of all, thank you for share this content, it’s awesome! Could you share how did you get the measures in the json file? I exported the json file normally, but when I put it into power quary editor I could not find the measures names. 🙁
Larissa meint
Same here. Did you find a solution?
Charaf meint
Very nice blog Lars,
Can you share the path and name of the exported JSON file?
I cant see the full path in the picture?
Kind Regards,
Charaf
From the Netherlands
Lars Schreiber meint
Hi Charaf,
thanks for your feedback. You don’t need to see MY path and MY name of the JSON file. It needs to be the path, where you saved YOUR JSON file and the name YOU specified. Makes sense?!
Thanks,
Lars
Charaf meint
Thanks for your quick answer,
I mean of the example?
i did make my own example but didnt see the measures in the json. So i try your example but i dont have the right json export for the example.
Levan meint
Many thanks from Tbilisi, Georgia!
cristina meint
Nice article.. could be possible to just include any column that has been used in the visuals?
In that way we can decide if that column or column really can be remove or stay.
Cody meint
Hi Lars,
Super tool!
For most of the pbix files it works great, however last I get an OLE DB error.
The pbix. file contain a dataflow as source, could this be the reason I got the error??
And how to solve it?
elena meint
Thank you! That’s great!
JMvS meint
Really cool, easy & useful solution, thank you for sharing!
Sam Benson meint
With many thanks!!
I have been looking for something that will help remove all the redundant and duplicate measures that I don’t need.
Denis HAVE meint
Hi Lars,
I have a problem in reading JSON file, i cannot find howto to arrived to the list of ‚Used_Measures_In_Visuals‘.
Please can you help me to transform the powerBIperformance.json into table with only used measures.
Thanks a lot for your help.
Denis HAVE meint
Hi Lars,
I have a problem in reading JSON file, i cannot find howto to arrived to the list of ‚Used_Measures_In_Visuals‘.
Please can you help me
Sri meint
Hi, Very valuable article. However, I use live connect(SSAS tabular model) as our source to Power BI and hence not able to do a lot of things using your pbix. I was wondering how you were able to just get the measures name from the performance analyzers json file ? I am trying to see what measures are used across all our pbix files and get rid of old/unused measures.
I also get 0 rows when I run the query SELECT * FROM $SYSTEM.discover_calc_dependency in DAX studio. Do you know why this happens?
Appreciate your help.
Thanks,
SN
Fredrik Vestin meint
Lars!
This is fraking awesome! Thanks for providing such a nice tool together with very clear instructions for usage!
Lars Schreiber meint
Hi Fredrik,
thanks for your positive feedback. I am very happy that it helped you out 😉
Cheers,
Lars
Andrey meint
Hi! Thanks for this article, it really helps! Could it work with calculated columns?
Lars Schreiber meint
Hi Andrey,
thanks for your feedback and question. Yes, it is possible to also include (calculated) columns/ tables, but if a column/ table is not used in any measure, it doesn’t mean, that it is not used att all. Think of bridge tables. It is likely, that they will not appear in a measure formula, but they are necessary for the data model. This is why I did not include them in my solution, because it would/ could lead to wrong conclusions.
Does that make sense?
Thanks and cheers,
Lars
Steffen meint
Nice solution.
It would be useful to include columns anyway. If they are used in relations, they can be identified using SELECT * FROM $SYSTEM.TMSCHEMA_RELATIONSHIPS
Upen meint
Hi Lars,
Could you suggest how do I replace Process Id in you power bi file to create connection and use the extracted json file?
Much appreciated for the help.
Kind regards,
Upen
Lars Schreiber meint
Hi Upen,
I was not able to replace the process id and get access to the SSAS tabular instance. This is why I suggested connect to SSAS tabular directly using the code from my last reply.
Cheers,
Lars
Upen meint
Hi Lars,
Thanks for posting the wonderful article to categorize used and unused filters.
I tried for the power bi file which has got the live connection. I couldn’t use DAX studio to get Process Id. Could you please suggest me how do I capture the Process Id for the live connection file mode? I opened the task manager to get Process Id for the power BI file but it didn’t work.
Your suggestion is much appreciated.
Best regards,
Upen
Lars Schreiber meint
Hi Upen,
thanks for your feedback 🙂
In case of live connection to a SSAS tabular model, I guess it is best to not rely on the process id (the process in task manager is ‚msmdsrv.exe‘), but to create a connection to the SSAS model directly, like so:
= AnalysisServices.Database(Server like „334BA86J\SSASTABULAR“, database like „AdWorks“, query the specific DMV like so [Query=“SELECT * FROM $SYSTEM.discover_calc_dependency“, Implementation=“2.0″])
Hope that helps you out 🙂
Cheers,
Lars
Mika Kouvo meint
Hi Lars and Upen,
Great stuff!!! In case of live connection [Query=“select * from $SYSTEM.MDSCHEMA_MEASURES“,Implementation=“4.0″] (probably also with other implementations) will do the job. I used it successfully when connecting live PBI model in Premium workspace.
Cheers,
Mika
NATHANY DE ALMEIDA MIGUEL meint
Hi Lars,
My current dash has a live connection to a dataset published in the PowerBI Service. In order to to what you suggested in these cases (create a connection to the SSAS model directly), how I supposed to find the server name of a dataset published in the PowerBI Service? Or first of all, is it possible? Sorry for the question, I am noob at SSAS.
Thanks in advance!
Greetings from Brazil
Nathany
Kai meint
Hi Nathany, Lars,
I would also be interested if it is possible to find out unused measures for the setup where I have a seperate dataset .pbix w/o visuals and stand-alone .pbix files for visualizations / reports with a live connection to the published dataset in Power BI Serivce.
Any suggestions?
Regards