The thing about hard drives is that you save a lot of files and then you don’t look at them for years. I stumbled across a file from January 2015 these days: An installation file of Power BI Designer Preview, the predecessor of Power BI Desktop. You don’t remember that?! Then take a look at what has happened to Power BI Desktop in the last three and a half years 🙂
The name
Before Power BI Desktop was launched in July 2015, the product was called Power BI Designer Preview. In my opinion, „Designer“ was the better choice because it makes it very clear that it is a development environment and not a tool to create reports and distribute them via email. On the other hand, „Desktop“ makes it clear that it is the counterpart to the cloud service and that makes sense, too.
The icon
The logo has changed fundamentally. What was originally the Excel green is now a bright yellow and the big B (I have no idea what this stands for) has been replaced by the familiar design. This made it clear that it was no longer just the outsourced Power BI tools from Excel, but that something of its own would be created.

The development interface
If you look at the development interface, you can see very impressively what 41 monthly updates can change in a software. I tried to recreate a report I created in the current version of Power BI Desktop (which is June 18), using Power BI Designer Preview. This is the comparison:
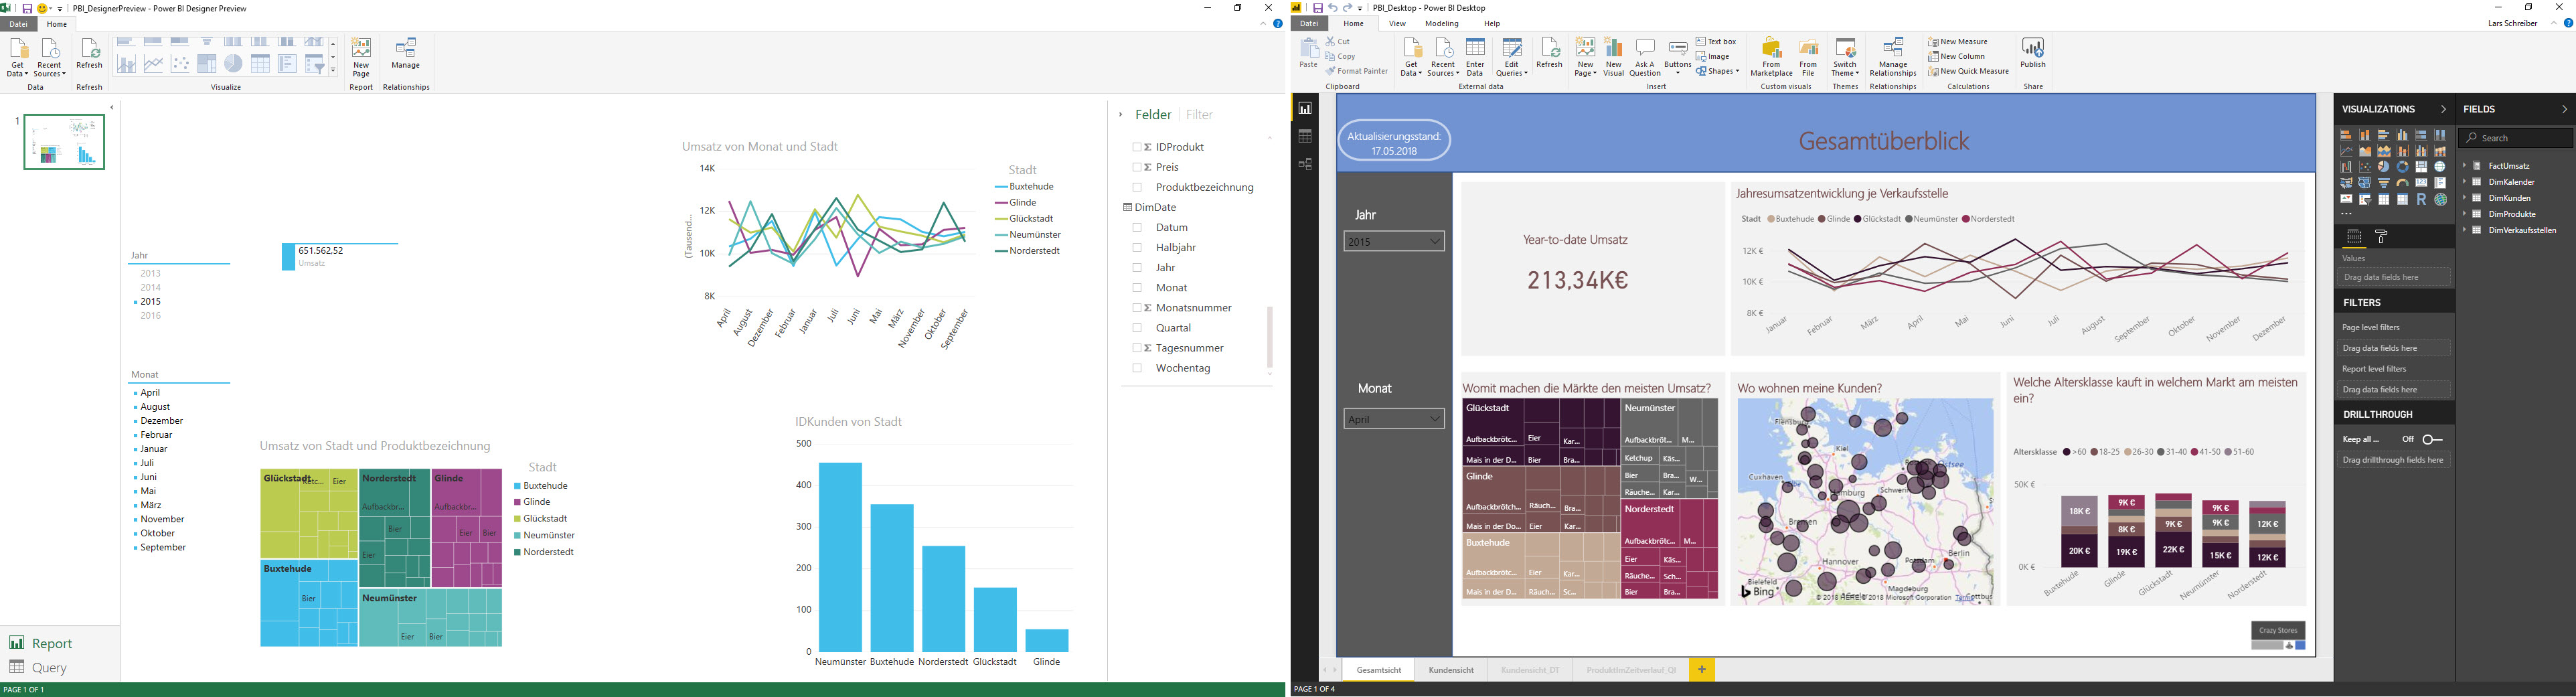
Let’s go through the differences in detail…
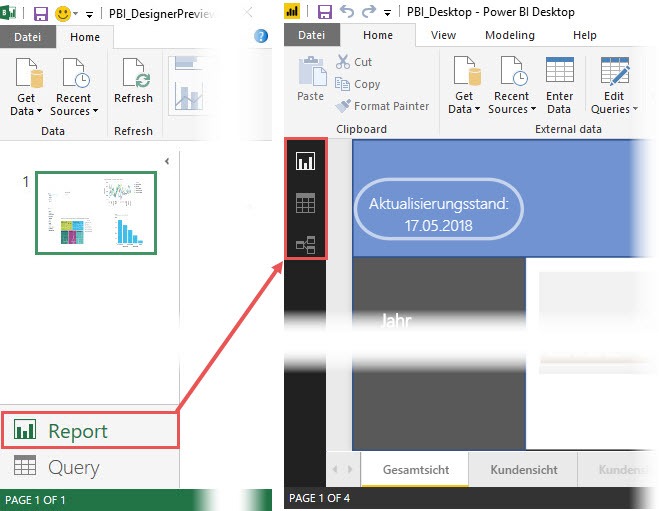
Views
The views have moved from bottom left to top left and have turned into small icons. Since there was no access to the data model in the Power BI Designer Preview, the icons for the data view and relationship view are missing here. This feature was added in April 2015. In the Designer Preview, Power Query was interpreted as a view, which later disappeared from the views in Power BI Desktop.
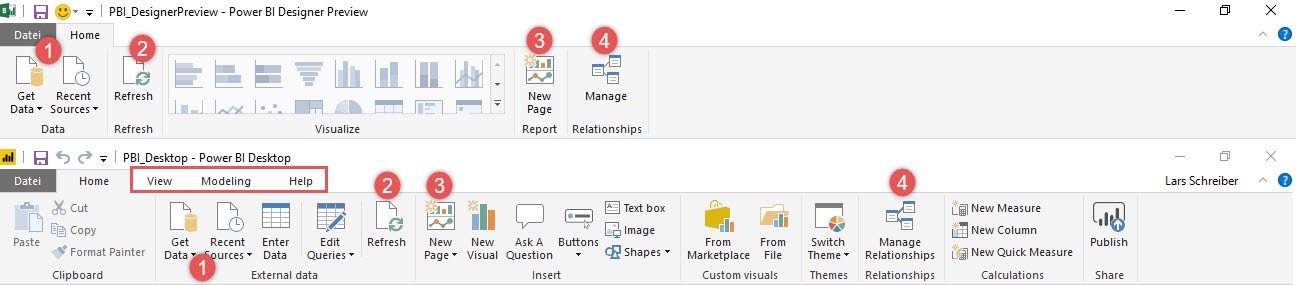
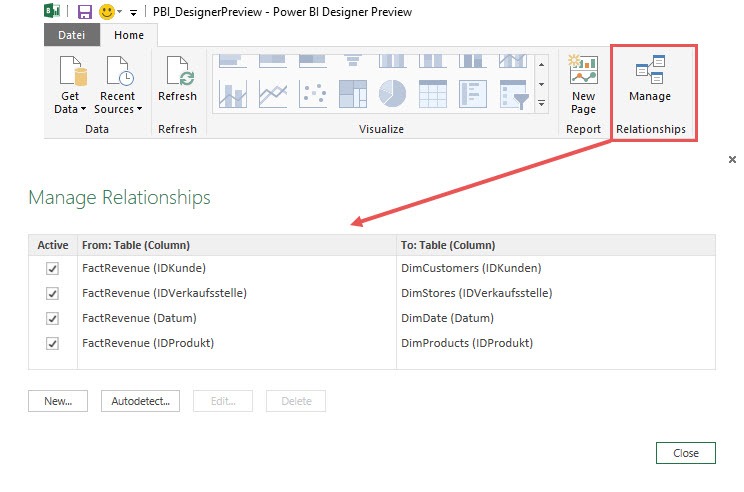
Ribbon tabs
If you compare the ribbons of both programs, you will immediately notice that Power BI Designer Preview only had a Home Tab. In the course of time the tabs View, Modeling and Help have been added here. Within the home tab there were basic functions to connect data sources (1), refresh (2), create new report pages (3) and influence relationships between tables (4), which are still part of the ribbon in Power BI Desktop today.
Since then, so many functionalities have appeared, such as
- uploading to the Power BI Service,
- creating calculated columns, tables and measures,
- inserting images and text fields,
- Q&A,
- using buttons
- creating custom themes,
- etc.
and of course all the things that hide behind the added ribbon tabs View, Modeling and Help, which are:
- Creating reports in phone layout,
- adding bookmarks,
- sync slicers,
- using role level security (RLS),
- even train Q&Q, using the linguistic schema.
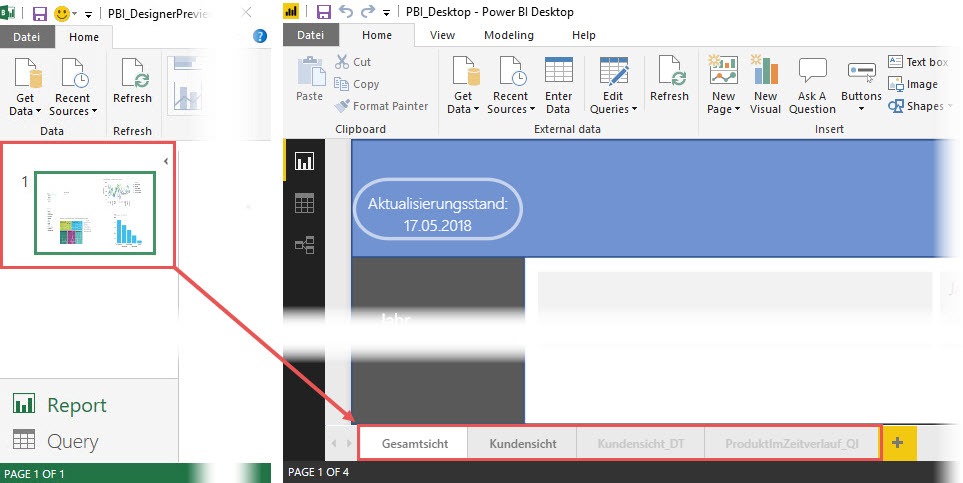
Pages
Pages could be selected in Power BI Designer Preview on the left side and they had a small preview. In today’s version they are at the bottom and are similar to sheets in Excel.
Ability to change styles, themes, colours etc.
When I tried to recreate my report from Power BI Desktop true to the original in the Designer Preview, I only noticed how many features for formatting and adapting visuals have been added over time.
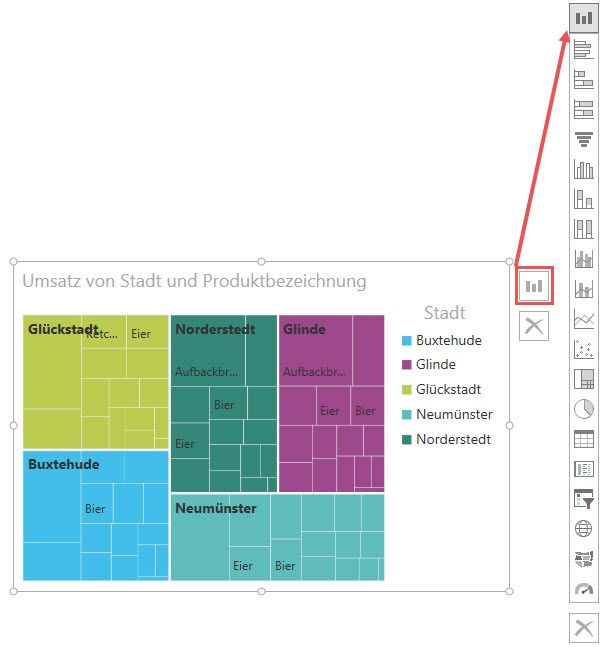
When I activate a visual in Power BI Designer Preview, I have the possibility to change the type of visual afterwards. But I am not able to make color adjustments, move legends or adjust font sizes. And now look at what has changed since then:
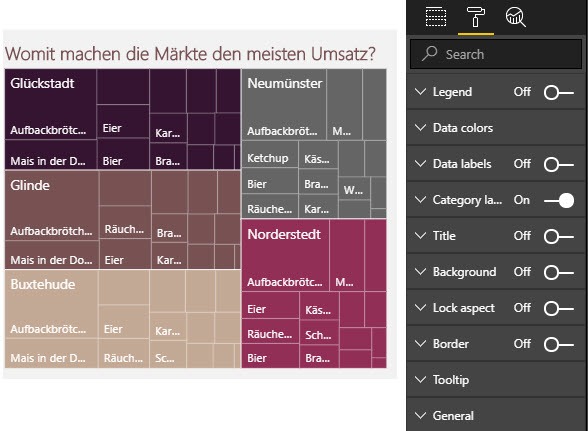
Now we have extensive possibilities to influence the appearance of the individual visuals, e.g. we can now place legends and show or hide the colors of individual data series explicitly.
Power Query
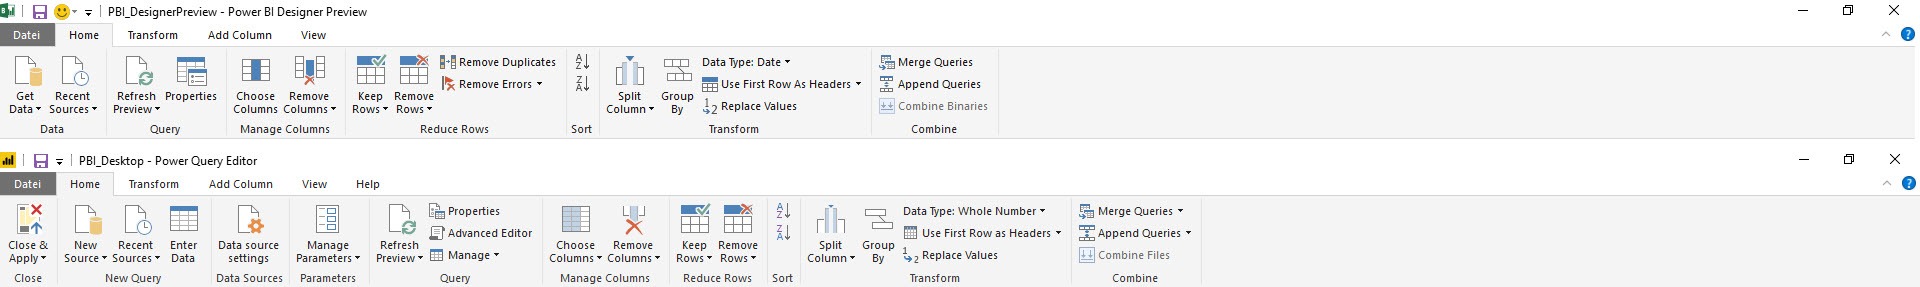
As much as has been developed in recent years for Power Query: The development team was well aware of the basic functionalities, because when you look at the ribbon tabs, only a few fundamental changes can be seen.
Home tab
The main changes, that I recognized are the following:
- Close & apply: Today we have the possibility to close queries without apply. Previously, additional steps were applied automatically.
- Using the clip board: We can now input data from the clip board.
- Parameters: We can now create parameters that were previously not possible.
Transform tab
The main changes, that I recognized are the following:
- Pivot tables: Even if the M function
Table.Pivot()already existed, no pivot command could be selected from the GUI. It’s easier today - Using R in Power Query: Today we have the possibility to write ETL scripts with the language R. This should be a game changer for many users who know R
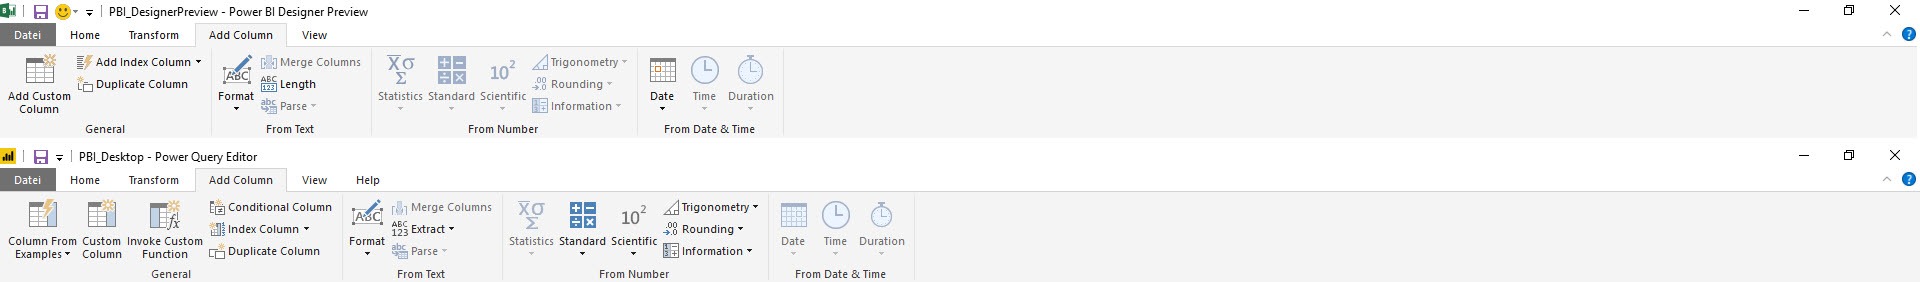
Add columns tab
The main changes, that I recognized are the following:
- Column from example: This feature is a great way to create new user-defined columns quickly and easily, even without M functions
- Invoke custom functions: You can call custom functions by using the GUI
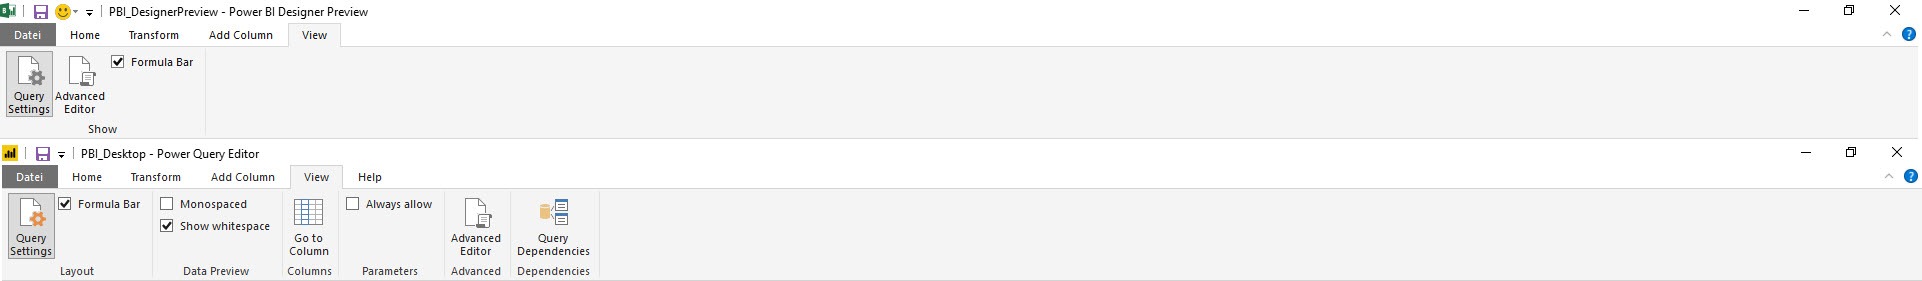
View tab
The main changes, that I recognized are the following:
- Go to column: If you have to deal with wide tables, this functionality is great for accessing certain columns.
- Query dependencies: It is often important to know the interdependencies between queries. This feature makes life easier for a query developer.
Help tab
This tab exists only in Power BI Desktop. In my own experience, far too little attention is paid to this tab by users. It contains a lot of information and resources: From training videos and documentation to the possibility to place new ideas for Power BI Desktop directly with the user voice. I find that extremely useful.

A very hidden possibility here is that you can copy all existing M scripts to the clipboard as follows:
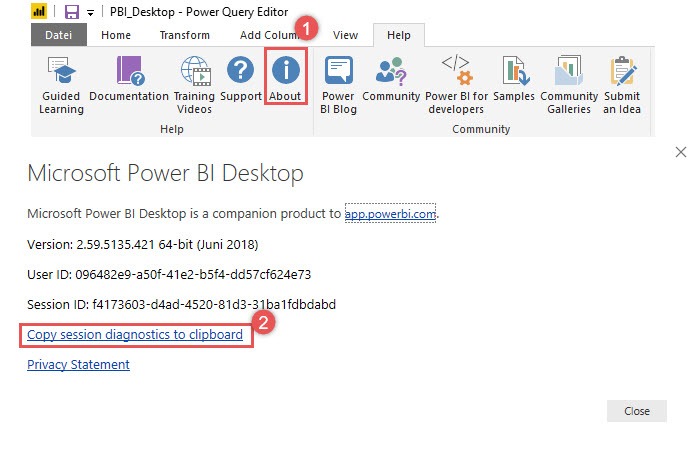
I learned this from Chris Webb, but couldn’t find the post again, so sorry Chris, that I did not refer to your post directly 🙂
Data model/ DAX
As you may have seen in the views, there are no relationships view nore data view. I am able to influence the relationships between the tables via a corresponding menu item in the ribbon. This reminds me of the possibilities in Excel when I have a license without access to Power Pivot. This will soon also be a thing of the past in Excel
At that time, it was not yet possible to write measures in DAX. This would be delivered with the update in April 2015 and think about what is possible with DAX in Power BI Desktop today:
- measures,
- calculated columns,
- calculated tables and
- quick measures…
… amazing 🙂
41 updates later
Since the version of PBI Designer Preview we got 41 updates… one every single month, which is an outstanding achievement. You can find all the changes documented on this website. But it is not only the technology that has evolved continuously. A complete ecosystem has developed around Power BI, some parts initiated directly by Microsoft, others by enthusiastic users of the technology. Here is a list of bloggers, which have IMHO the most impact on the Power BI community. As I only speak German and English you will find only those who write in German or English. So, if you’re from China writing chinese blog posts, please excuse me for not including you on this list:
Sie sehen gerade einen Platzhalterinhalt von Standard. Um auf den eigentlichen Inhalt zuzugreifen, klicken Sie auf die Schaltfläche unten. Bitte beachten Sie, dass dabei Daten an Drittanbieter weitergegeben werden.
Regards from Germany,
Lars
I write my posts for you, the reader. Please take a minute to help me write my posts as well as possible. Thank you 🙂
[yasr_visitor_multiset setid=2]

Lars ist Berater, Entwickler und Trainer für Microsoft Power BI. Er ist zertifizierter Power BI-Experte und Microsoft Trainer. Für sein Engagement in der internationalen Community wurde Lars seit 2017 jährlich durch Microsoft der MVP-Award verliehen. Lies hier mehr…
Carlos meint
Hi, would it be possible that you pass me that Power BI Designer Preview installer? I´m currently elaborating my final Masters Degree project about BI and i would like to remark some of the differences between that early version and todays version by myself. I can´t find the installer nowhere.
Would that be possible? Thanks in advance,
Taras meint
You can include in list Michal Chmelar from Slovakia.
https://www.power-bi.sk/
Lars Schreiber meint
Hi Taras,
thanks for that hint, but this list cointains people I regularly read. I did not try to create a complete list of all blogging Power BI enthusiasts worldwide. In addition Michal doesn’t seem to write in English, so I am not even able to understand his blog 🙁
Thanks,
Lars