I am a huge fan of Power Query and the M language, but honestly I find it a bit inconvenient to create lists of date values or datetime values, using the standard M functions List.Dates() and List.DateTimes(), mainly because I cannot define an end date/ datetime value for my list, but have to specify the count parameter. For that reason I created my own custom function GetTableOfDateAndDateTime(), which I want to share and explain with this post.
You can copy all code samples from down below. If you already have my Power Query editor for Notepad++ (or want to build it) you can paste the code in Notepad++. Otherwise just copy it and paste it into the Advanced Editor of Power Query in Excel or Power BI Desktop.
Update, 7th of June 2018
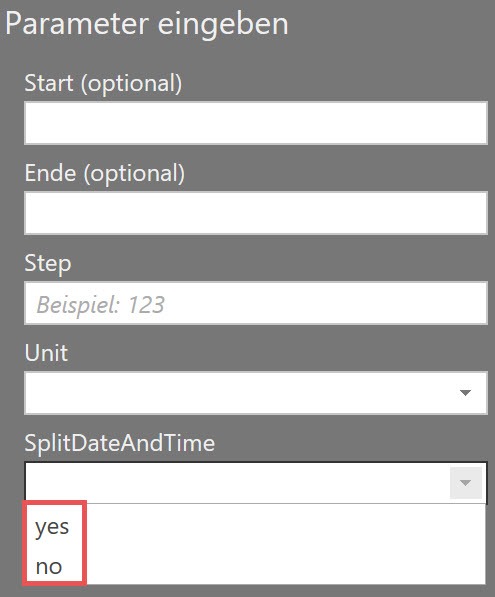
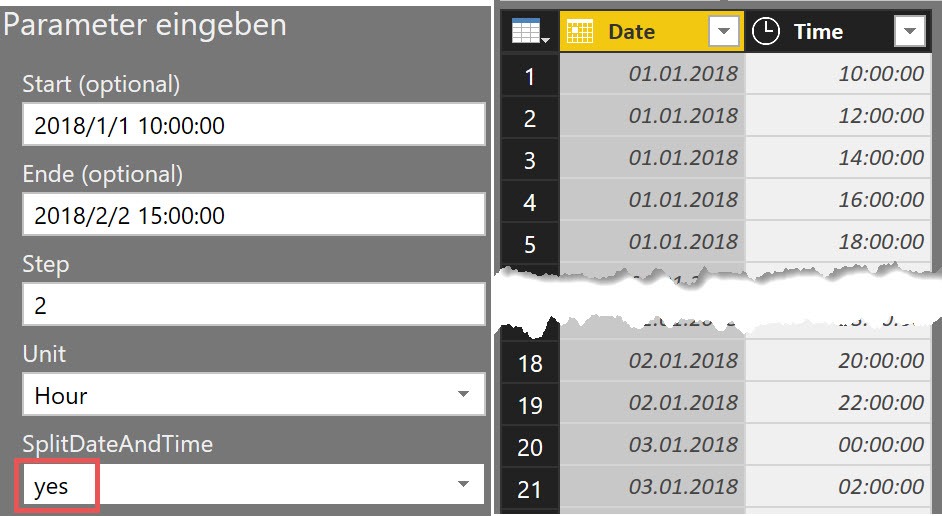
Due to the feedback from Uwe Mester and Maxim Zelensky, I extended my function so that you can decide if a table with datetime values should be split into two columns (one for date, the other for time). This is done on the basis of the „SplitDateAndTime“ parameter:
Here comes an example:
All other points below remain.
Purpose of the function
The purpose of this function is to easily create tables for date and datetime values with any increment, based on a start date/datetime and an end date/datetime.
Functionality of the function
Here you learn everything about accepted parameters and the rules how to use them in the function.
Accepted parameters
- Start of type date or datetime, e.g. 2018/1/1 or 2018/1/1 01:05:13 → important is to observe the following structure: YYYY/MM/DD or YYYY/MM/DD hh:mm:ss
- End of type date or datetime, e.g. 2018/1/1 or 2018/1/1 01:05:13 → important is to observe the following structure: YYYY/MM/DD or YYYY/MM/DD hh:mm:ss
- Step of type number, e.g. 1, 12, 27
- Unit of type text, which has the allowed values Day, Hour, Minute and Second
Rules
- Start and End must be of the same type. They must be either of type date or both of type datetime.
- Start must be before End.
- Step must be a positiv number
Examples
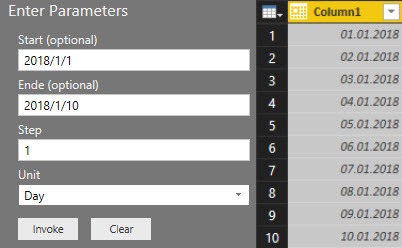
Get a table of dates, starting from the 1st of January until the 10th of January, growing day-wise with an increment of 1:
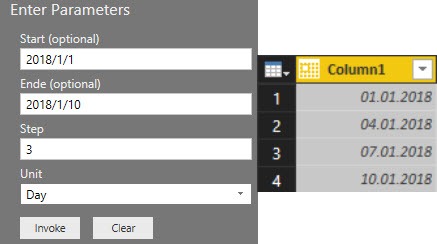
Get a table of dates, starting from the 1st of January until the 10th of January, growing day-wise with an increment of 3:
Even if your entries for Start and End are of type date, you can let your table grow with the units Hour, Minute and Second. In this case, the calculation starts at 0 o’clock on the start day and continues until the end day at 0 o’clock. The following example shows how to grow your table by hour, starting at 1st of January 2018 and ending at the 2nd.
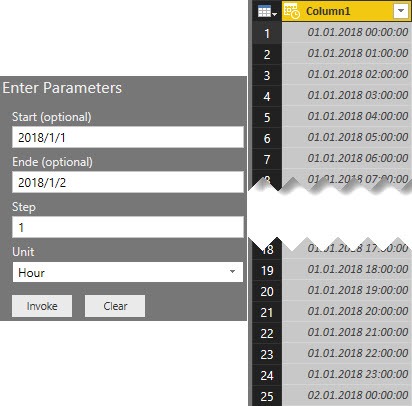
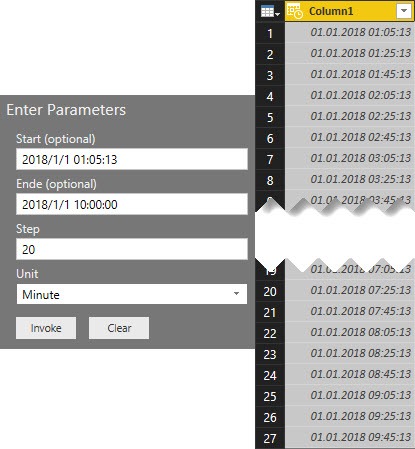
If you want to define start and end times more granularly, you can do this by entering Start and End as datetimes. The following example starts the table at the 1st of January 2018, 01:05:13 and ends at the same day, 10:00:00. The table grows in 20-minute steps:
The function body
You can use the following M code as you like. Just copy it into the Advanced Editor in Power Query and give it a meaningful name, e. g. GetTableOfDateAndDateTime.
https://gist.github.com/SchreiberLars/7e2f2d9a31f4e613daf2fa620e384f9b
I am looking forward to your feedback and suggestions for improvement.
Regards from Germany,
Lars
I write my posts for you, the reader. Please take a minute to help me write my posts as well as possible. Thank you 🙂
[yasr_visitor_multiset setid=2]

Lars ist Berater, Entwickler und Trainer für Microsoft Power BI. Er ist zertifizierter Power BI-Experte und Microsoft Trainer. Für sein Engagement in der internationalen Community wurde Lars seit 2017 jährlich durch Microsoft der MVP-Award verliehen. Lies hier mehr…
Maxim Zelensky meint
Hi Lars! Nice and convenient function.
I think it is better to create separate date and time columns due to following best compression and speed
Lars Schreiber meint
Hey Maxim,
thanks for your feedback. Fair point. I will add this shortly to my function and update the documentation here.
Cheers,
Lars