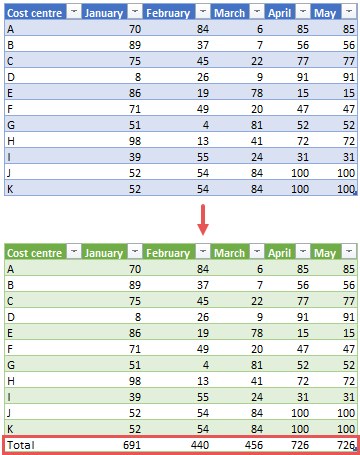
Normally I calculate sums in Power Query over rows. Recently, however, I was given the task of calculating sums over columns. I wrote a German-language post about this here and used mainly functionalities of the UI.
Power Query guru Bill Szysz has commented this post (even though it was in German) and sent me another alternative solution via email. He gave me his permission to share this solution with you here. In addition, I already had a conversation with my friend and Power Query guru Imke Feldmann about another alternative solution, which I have also included in this article. Happy learning 🙂 You can download the sample file here.
The goal
The goal is to create a row at the end of the table that represents the total for the month columns and contains the row label ‚Total‘ in the first column.
Alternative Solutions
Imke and Bill have sent me their solutions, but the comments of the source code are from my pen. With this I wanted to make it easier for you as a reader and I hope that I didn’t make any mistakes. If you find any mistakes here, it’s on me.
Solution #1 – by Bill Szysz
Solution #2 – by Bill Szysz
Solution #3 – by Imke Feldmann
Conclusion
There are many roads to the solution. These 3 here, seem very creative to me and show quite different ways to solve the problem. With the available (relatively small) amount of data, the 3 methods seem to be almost equally fast. Of course this would have to be tested with larger amounts of data, but that’s not what this post is about :-). I thank Imke and Bill a lot for their solutions. I have learned a lot. Which of them do you find the most exciting?
Cheers from Hamburg, Germany
Lars

Lars ist Berater, Entwickler und Trainer für Microsoft Power BI. Er ist zertifizierter Power BI-Experte und Microsoft Trainer. Für sein Engagement in der internationalen Community wurde Lars seit 2017 jährlich durch Microsoft der MVP-Award verliehen. Lies hier mehr…

Mahmoud Bani Asadi meint
This is an excellent topic! Here’s my custom function designed to achieve something similar.
= (tbl as table) =>
let
_type = Table.TransformColumnTypes(tbl,Table.ToRows(Table.ReplaceValue(Table.Distinct(Table.UnpivotOtherColumns(tbl, {}, „Attribute“, „Value“), {„Attribute“}),each [Value],each Value.Type([Value]),Replacer.ReplaceValue,{„Value“}))),
total = _type & Table.PromoteHeaders(Table.Transpose(Table.ReplaceValue(Table.SelectColumns(Table.AddColumn(Table.Profile(_type), „Sum“, each [Average] * [Count], type number),{„Column“, „Sum“}),
each [Sum],each if [Column]=Table.ColumnNames(_type){0} then „Total“ else [Sum],Replacer.ReplaceValue,{„Sum“})), [PromoteAllScalars=true])
in
total
sandeep pawar meint
Lars, I dont see the solutions in the blog. I just see below. Do I need to download a file?
Solution #1 – by Bill Szysz
Solution #2 – by Bill Szysz
Solution #3 – by Imke Feldmann
mma173 meint
Thanks‘ for sharing this. There was lots to learn from the solutions provided by the very well recognized PQ gurus. It was a very good exercise too.
Here is the solution that I came-up with:
let
Source = Excel.CurrentWorkbook(){[Name=“Datenbasis“]}[Content],
ToSum = {„January“,“February“, „March“, „April“, „May“, „June“, „July“, „August“, „September“, „October“, „November“, „December“},
Sums = List.Transform (Table.ColumnNames(Source), each if _=“Cost centre“ then „Total“ else if List.Contains(ToSum,_) then try List.Sum(Table.Column(Source, _)) otherwise _ else null),
SumTable = Table.PromoteHeaders(Table.Transpose(Table.FromColumns({Table.ColumnNames(Source), Sums}))),
Combine = Table.Combine({Source,SumTable})
in
Combine