Before an analyst can start analyzing the data, first it is necessary to know whether the data is up-to-date or not. There are (at least) two pieces of information relevant: 1) When was the data model last updated and 2) Is the data in the data source up to date. With this post I want to show how I like to let my users know how up-to-date their data is.
How I like to present this information
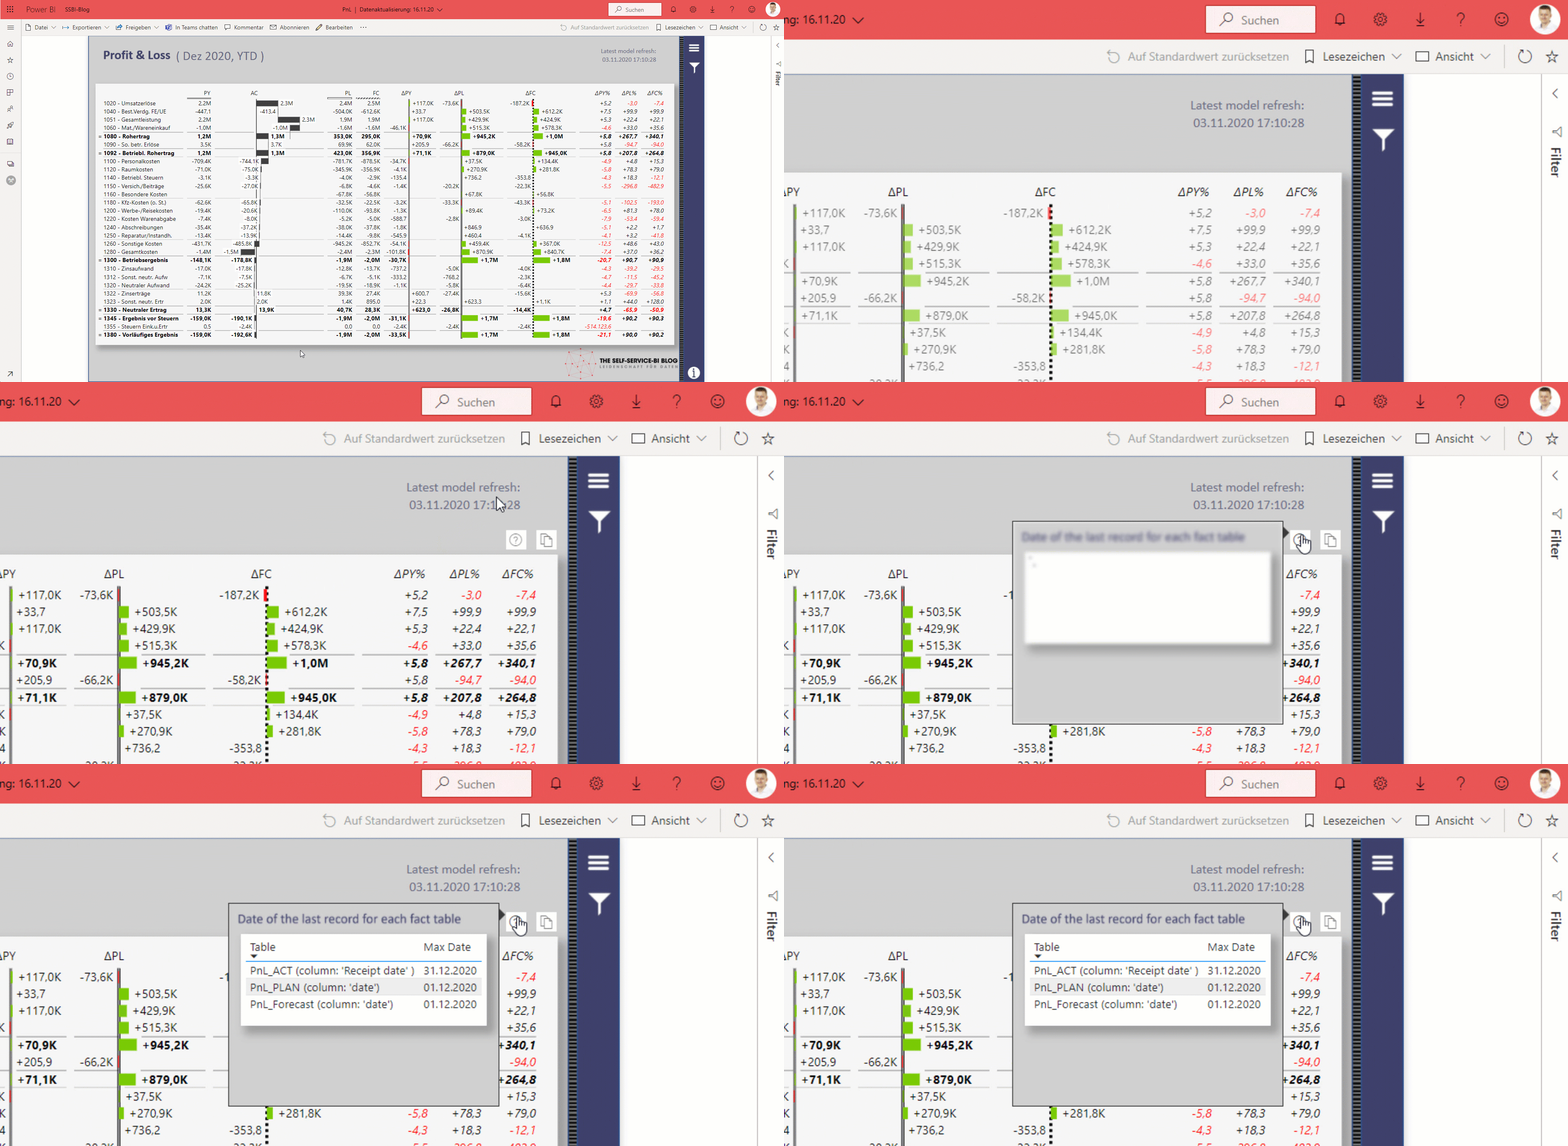
I think the information when the data model was last updated is probably the most important. I like to place this information directly on the report so that it is immediately visible and, in case the report is printed, it is also included on the print (…yes, many customers want to be able to print their reports 😐 ). Since this information is only needed in the second place and takes up more space in case of a data model with several fact tables, I provide this information via a visual header tooltip. This tooltip can be called up when this information is needed and thus does not constantly take up space on the report. Here I provide three pieces of information:
- The name of the table +
- the date column, on the basis of which I determine the max date and
- the actual maximum date
The animated GIF below shows how I provide this information:
If you are now wondering how this information gets into the report, read on.
Latest data model refresh
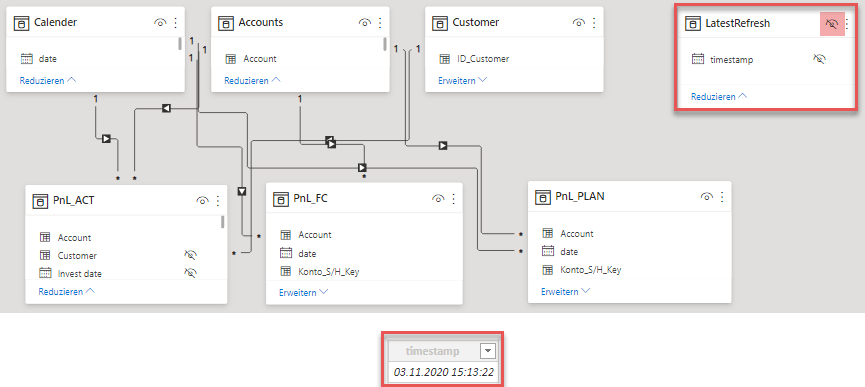
There are several approaches to store and report the lastest update of the data model. I present 3 versions and all those versions are based on a Power Query query, which provides the interesting timestamp , which is then loaded into the data model as a disconnected and invisible single-column, single-row table.
Version #1: DateTime.LocalNow()
You can find several solutions for this topic which use the M-function DateTime.LocalNow() to load a table which stores the current time at every refresh of the data model. I blogged about it in 2017 (in German) and here you can find a similar version from Kasper de Jonge. The problem with this approach is the following: The datetime value returned by DateTime.LocalNow() depends on the system of the computer on which the M script is executed. Which computer this is is sometimes not clear at first sight. Here are a few scenarios as an example:
You publish manually from Power BI Desktop to the Power BI service
DateTime.LocalNow() returns the datetime value of the operating system on which Power BI Desktop runs.
Scheduled refresh based on cloud data sources (no Gateway involved)
In case you are working with cloud data sources, the M-script is executed on the server in the Microsoft data center, where your Power BI datasets are located. In my case this is a data center in Ireland. Ireland is not in the same time zone as Germany. Therefore DateTime.LocalNow() returns a different value here than e.g. on my local laptop.
Scheduled refresh based on on-premises data sources (Gateway involved)
If you automate the data update to the Power BI service through an on-premises data gateway, all M-scripts are executed in the gateway before they pass through the network in compressed form to the Power BI service. Thus, the datetime value returned in this case depends on the system on which the gateway is installed.
There are certainly other scenarios. What these 3 points should show is that DateTime.LocalNow() is probably not the safest method to get the desired result. Let’s look at alternatives.
Version #2: DateTimeZone.FixedUtcNow() to the rescue
An alternative approach would be to use the function DateTimeZone.FixedUtcNow() in combination with DateTimeZone.SwitchZone() like so: DateTimeZone.SwitchZone( DateTimeZone.FixedUtcNow(), 1). While DateTimeZone.FixedUtcNow() displays the current time in ‚Coordinated Universal Time‘, the second parameter of the DateTimeZone.SwitchZone() function lets me shift the UTC time by x hours (and also minutes if needed). This sounds like a great alternative to DateTime.LocalNow() but the devil is in the details.
Since I live in Germany and we are still jumping diligently between summer time (aka Daylight savings time) and winter time here, in my case this difference to UTC time cannot be static, but has to move between 1 and 2 depending on the date. I have already blogged about this here in German.
So this approach leads definetely to a useful result, but instead of calculating the – sometimes changing – difference to UTC time, it would be nicer if you could simply specify the desired time zone and get the datetime value, wouldn’t it? In this case I use REST API calls.
Version #3: Calling a REST API
Instead of worrying about how to calculate the difference between UTC and my own time zone, you could use a web service of your choice. The following script calls a REST API that returns the current date and time in the desired time zone (passed as parameter), which in my case is CET – Central European Time.
Whichever of the above methods you choose to save the time of the lastest data update: The result will be a single-column and single-row disconnected table in the data model, which you will probably hide there.
Putting this info on the report
To put this info into a report, you should put the datetime value into a DAX-measure, so that you can control the formatting (including line breaks). The following DAX statement does the job:
LastRefresh =
„Latest model refresh: „ & UNICHAR ( 10 )
& FORMAT ( VALUES ( ‚LatestRefresh'[timestamp] ), „dd/mm/yyyy hh:mm:ss“ )
UNICHAR(10) creates the line break and the FORMAT() function makes sure I can format the datetime value as I need it. Put this measure in a card visual and you’re good to go. Now I make sure that the transaction data in the fact tables is up to date.
Last record of the transaction tables (aka fact table)
In case the data sources doesn’t already provide the data in the necessary structure, I am a strong advocate of doing all ETL tasks in Power Query, even if DAX could partially do the same tasks. Therefore, there are almost never columns or tables calculated with DAX in my data models. In the current case, this is different. My data model has 3 fact tables. In order to know if my data sources contain current data, I select the corresponding date columns from the fact tables, which I want to check for actuality. Normally these are date columns which are related to the calendar table. Doing this in Power Query could take muuuuch longer than doing it with DAX, so the decision is easy.
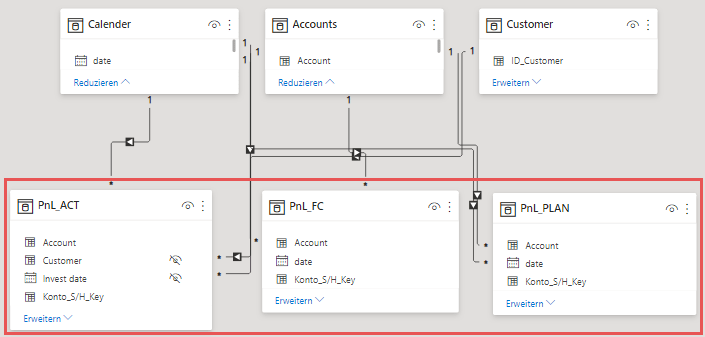
To create a table using DAX, which gives me the necessary information, I use the following DAX statement:
MaxDatesFactTables =
{
( „PnL_ACT (column: ‚Investment date‘ )“, CALCULATE ( MAX ( PnL_ACT[Invest date] ), ALL ( PnL_ACT ) ), 3 ),
( „PnL_PLAN (column: ‚date‘)“, CALCULATE ( MAX ( PnL_PLAN[date] ), ALL ( PnL_PLAN ) ), 2 ),
( „PnL_Forecast (column: ‚date‘)“, CALCULATE ( MAX ( PnL_FC[date] ), ALL ( PnL_FC ) ), 1 )
}
The result looks as follows:

The three columns contain the following information:
- Value1: Name of the fact table + info, based on which column the actuality of the data was determined.
- Value2: The maximum date of this specific column
- Value3: Using this value I can sort the table in the report.
Now let’s take a look at how I prefer to present this info.
This is how I prefer to present this information
I think the info, when the dataset had it’s latest refresh is important almost everytime… that’s why I include it on every page… but what about the latest dates in each fact table? This can be important, but I hardly need this info every single time I take a look at a report page… This is where visual specific tool tips become handy… I create a tooltip page (see the official documentation to know how that works) on which I display the disconnected table „MaxDatesFactTables “ as a matrix. Since the table created in DAX has the headings value1, value2 and value3, I overwrite them in the column captions of the matrix visual: value1 becomes Table and value2 becomes Max Date.
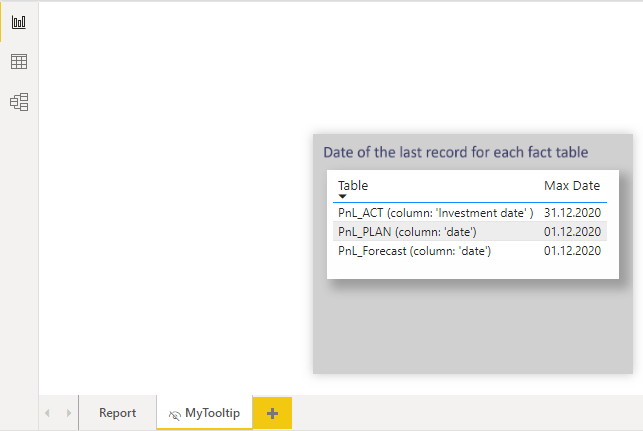
To place this tooltip in the visual header of the card visual, I go to the format properties of the card visual in which the LatestRefresh is located.
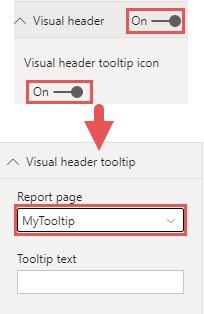
I turn on the visual header (if not already done) and activate the ‚Visual header tooltip icon‘. After that a new menu item appears in the format properties: ‚Visual header tooltip‘. Here I select my tooltip page in the field ‚report page‘. Done! 🙂
Additional information in the Power BI service: When was last uploaded?
In addition to the lastest refresh of the data model and the actuality of the data in the data source, the question sometimes arises as to when the data was last uploaded to the Power BI service. If you update your data via scheduled refresh, the time of the last model refresh and upload to the Power BI service will be (nearly) identical. However, if you manually publish your data to the Power BI service (via Power BI Desktop), then model refresh and publishing to the Power BI service are two processes that can vary greatly in time. This information is available to every user directly in the report.
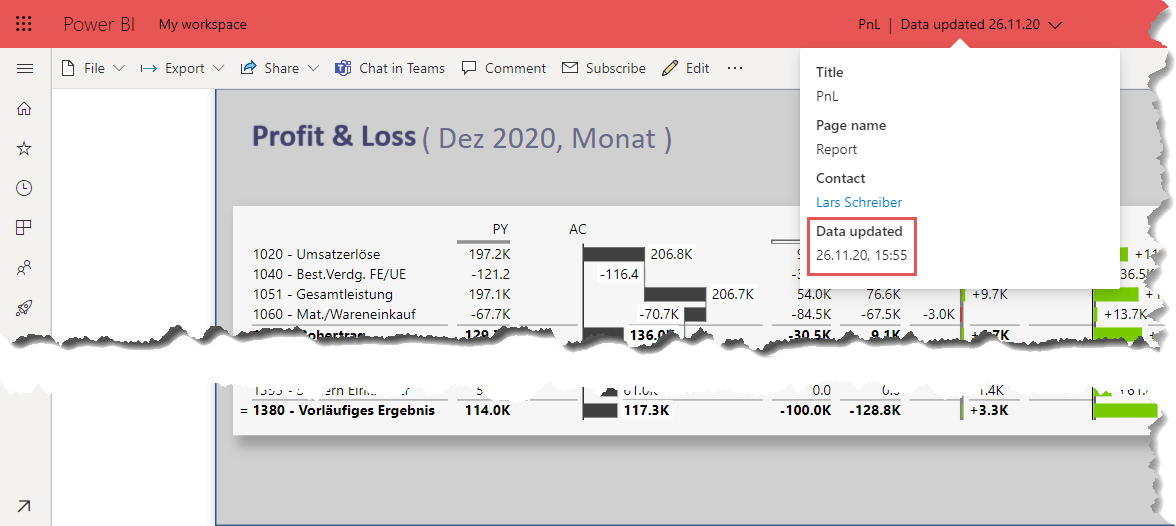
And as mentioned at the beginning: Even if you automatically update your Power BI dataset (and thus the lastest model refresh and the upload to the Power BI service have identical times): If you want to print the report, you have to put the info on the report yourself 😉
Cheers from Germany,
Lars

Lars ist Berater, Entwickler und Trainer für Microsoft Power BI. Er ist zertifizierter Power BI-Experte und Microsoft Trainer. Für sein Engagement in der internationalen Community wurde Lars seit 2017 jährlich durch Microsoft der MVP-Award verliehen. Lies hier mehr…
Neueste Kommentare